Co-Written by Bernardo Muciño Koenig and Emmanuel Herrera
The real estate market is ruled by a metric: Price per square meter (or feet). It may seem as an arbitrary way to measure real estate pricing, but it is, generally speaking, the simplest and best way we can break down something complex into a comprehensible metric.
However, this does not apply to all types of properties, and in the world of land investment, this metric means very little. This is because two physically identical and adjacent parcels offered at the same price per square meter can realistically have completely different values.
The real question: why?
Land pricing is not set by comparables. Land value is directly proportional to what can, (legally) currently, be done with the land, regardless of recent comparables.
So before asking "is this a good price," the better question is: what can actually be built here, and does that pencil out as a business?
What zoning actually controls
In the US and Canada this is called zoning. In Baja California Sur, the governing document is the PDU, the Plan de Desarrollo Urbano, and the local term is “uso de suelo” which translate to land use.
One distinction matters before anything else. A unique lot sits inside an already approved grid, the rules for that specific parcel are already set. A development lot is closer to an open canvas, bound only by whatever the PDU allows for that zone. That difference changes how much a buyer can actually influence what eventually gets built.
Five terms come up constantly in this conversation:
- COS (Translates to Land occupancy coefficient) sets what percentage of the lot's footprint can be built on at ground level.
- CUS (Translates to Land use coefficient) sets the total buildable square meters allowed, relative to the size of the lot.
- Minimum lot size is exactly what it sounds like, the smallest lot which can be sold to third parties that the plan allows.
- Levels set the maximum height and the number of floors permitted.
- Housing units per hectare is calculated directly by the PDU and caps the maximum density possible for that urbanized area.
Together, these five numbers set the ceiling on what any lot can become. They vary by municipality and by zone, sometimes lot by lot.
The math, kept simple
Lot size multiplied by COS gives the ground floor footprint allowed. Lot size multiplied by CUS gives the total buildable square meters.
A real comparison makes this concrete. Take the same 1,000 square meter lot under two different zoning codes.
Code H5, four floors allowed at 0.4 COS: 1,000 × 0.4 = 400 m² CUS: 1,000 × 1.6 = 1,600 m²
Code H2, two floors allowed at 0.6 COS: COS: 1,000 × 0.6 = 600 m² CUS: 1,000 × 1.2 = 1,200 m²
Same lot. If both were listed at the same price, H5 delivers 400 more sellable square meters, roughly four extra condos worth of inventory. That difference lives entirely in the zoning code, not in the dirt.
Why maximum density isn't always the answer
Realistically, and counterintuitively, it is never the seller that sets the price, it is the market. If the seller sets the price based on their wishes or assumptions they risk creating a product that will not sell.
There are many scenarios in many settings where market demand is not aligned with the maximum density of a land parcel. This isn't necessarily a bad thing. In fact it can very often be positive. In the next section, we will apply the principles learned above and walk you through a case study of a spectacular parcel in San Jose where, well, less is more…
Case study: a parcel in San José del Cabo where less is genuinely more
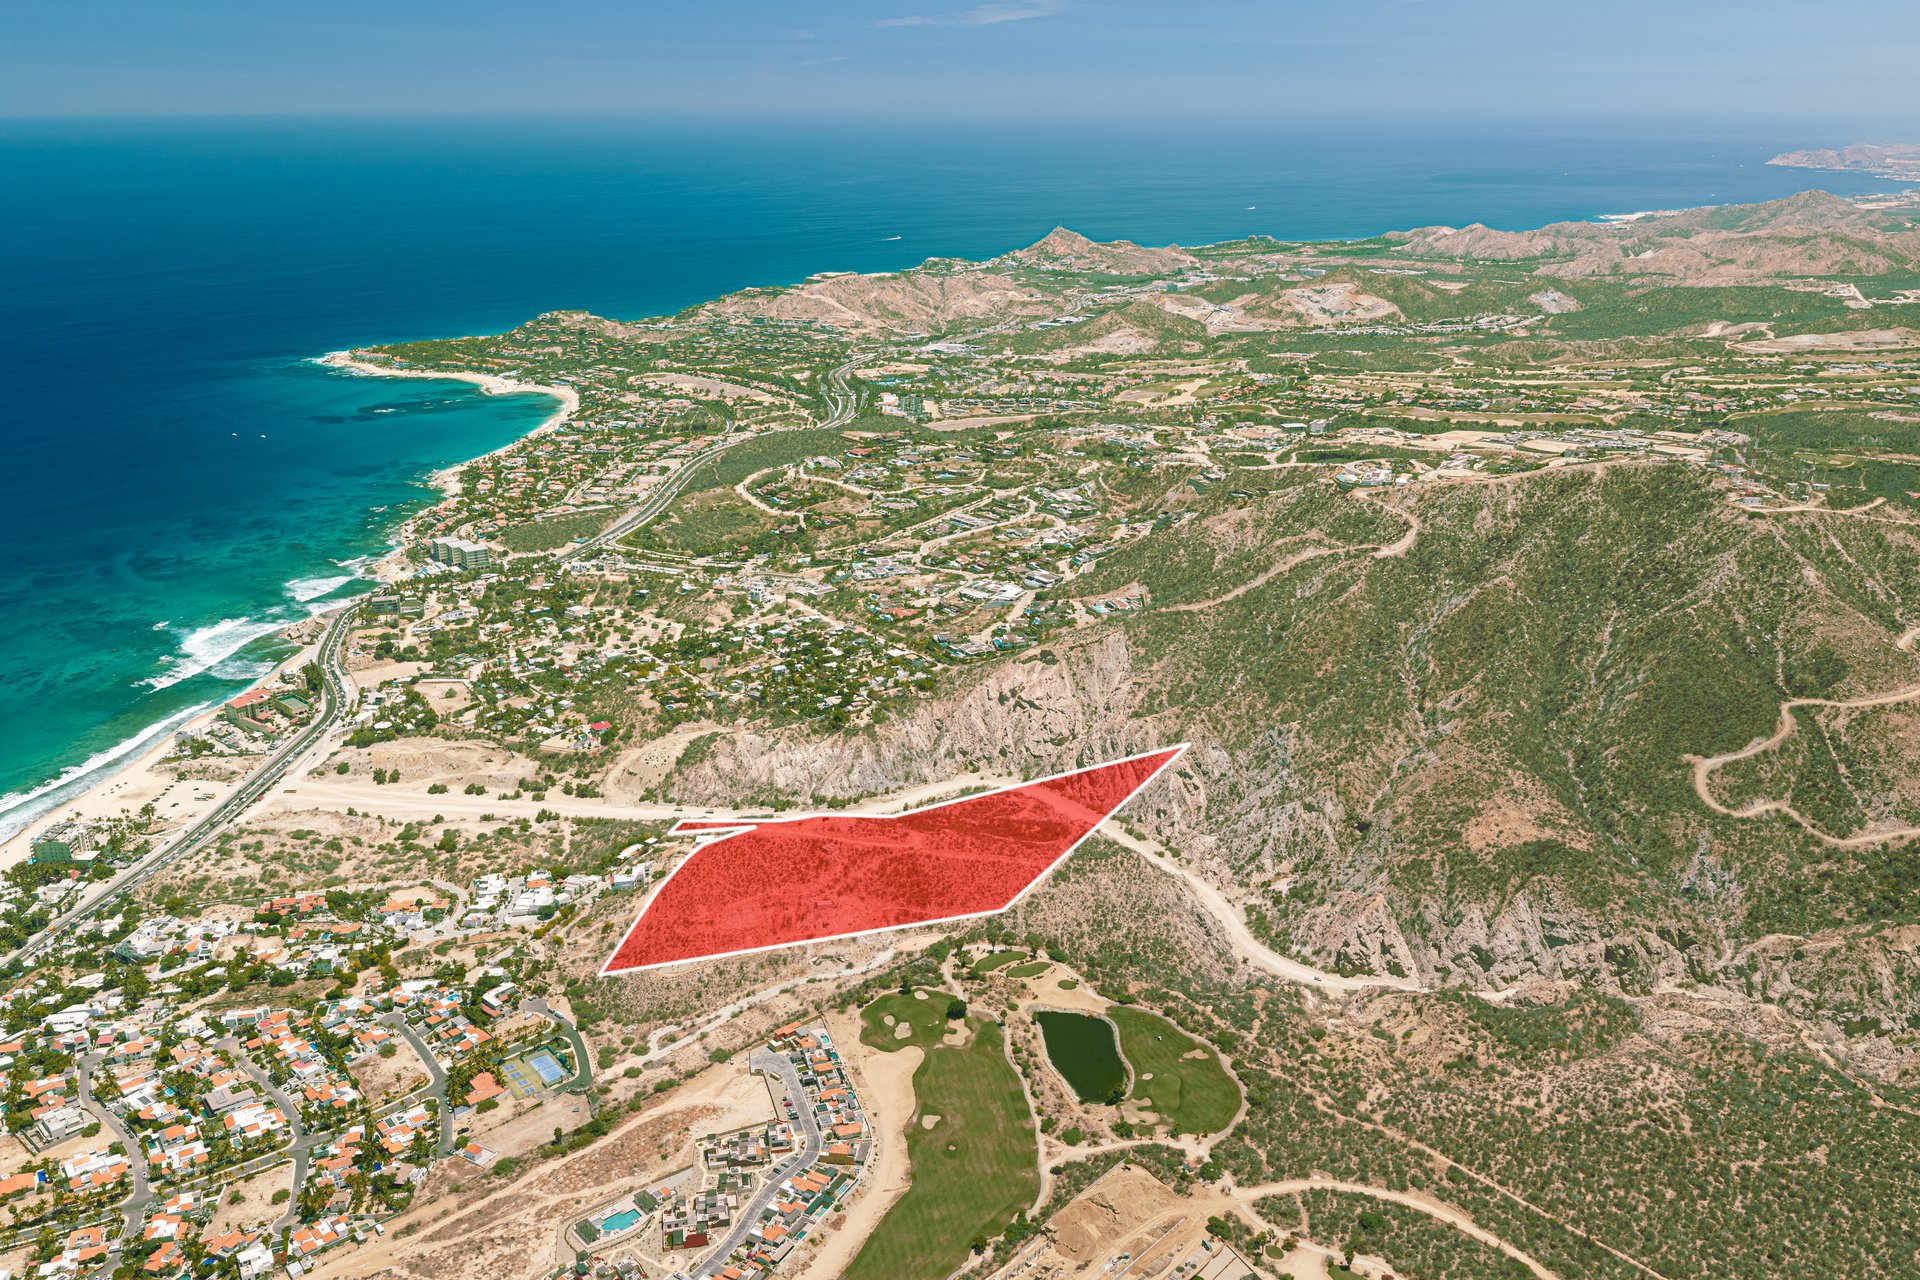
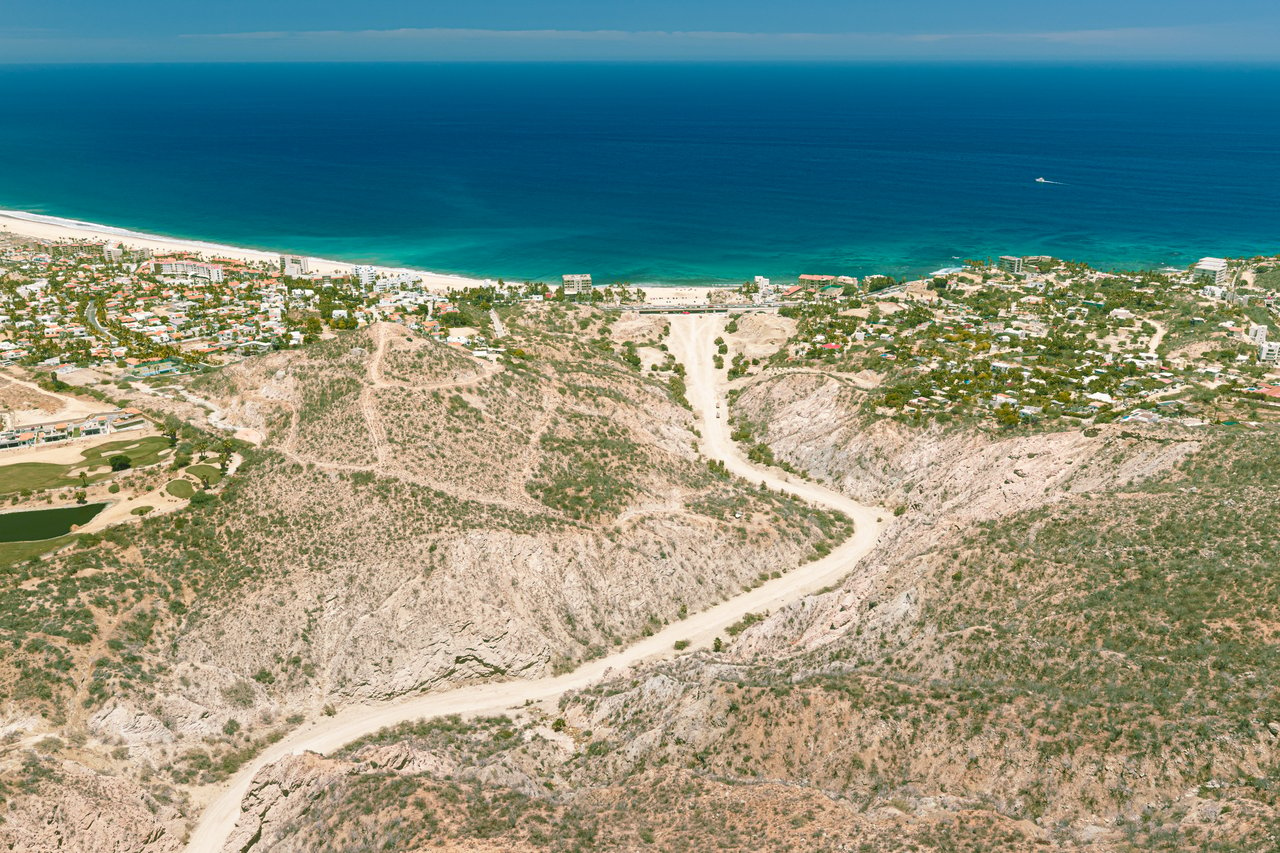
Montecito, one of the newer parcels we've brought to market, sits in San José del Cabo, at 55,414 square meters, with H1 zoning. It has a gentle slope, ocean and canyon views, and sits a few minutes from Costa Azul, the area's golf courses, and the downtown Art District.
5.5 hectares apply the CUS and COS math above to this specific parcel, and maximum density unlocks 116 condo units. That's the seller's-wishlist version of the plan, the one that maximizes unit count on paper.
Look at the same land through a different lens. Build houses instead, and the unit count drops to 58, at roughly double the price per unit. Run the totals, and both scenarios land on close to the same overall sales volume. Same land, same total square meters offered to the market, same total revenue on paper.
But "same revenue" is not the same as "same outcome." Based on comparable products already selling in the area, the condo scenario prices out around $650,000 per duplex condo unit, and the house scenario prices out around $1.5M per house. Those two products do not move at the same speed in this market. That's where MLS data, not the spreadsheet, has to make the call.
To size that speed, we're pulling absorption rates from two MLS brackets that serve as the source data, not the product price itself: condos priced $650k to $1.3M, and houses priced $1M to $2M in San José del Cabo. Those brackets give a large enough sample to be reliable. The actual units on this parcel would sit at the lower, more specific price point within each bracket, $650k for the condo product and $1.5M for the house product.
Absorption rate sourced from MLS bracket, condos $650k to $1.3M, San José del Cabo: (1.58 units / month) — absorption rate sourced from MLS bracket, houses $1M to $2M, San José del Cabo: 1.45 units / month)
Scenario A: Duplex Condos | Scenario B: Houses | |
|---|---|---|
Density | Maximum allowed | Below maximum |
Unit Count | 116 | 58 |
Individual Unit Price | $750,000 USD | $1,500,000 USD |
MLS bracket used to source absorption rate (San José area) | $650k-$1.3M | $1M – $2M |
Total Sales Volume | $87,00,000 USD | $87,000,000 USD |
MLS Absorption Rate | 1.58 | 1.45 |
Estimated Sellout Timeline | 73.42 months (6.12 years) | 40 months (3.3 years) |
Two paths to the same number on a spreadsheet, and two very different businesses underneath it. One sells out fast because it matches what buyers in that price band are actually shopping for right now. The other can sit on the market for years chasing a segment that isn't moving at the same pace, even though the total revenue projected was identical on day one.
That's the actual lesson here, and it cuts against the instinct to always build to the legal maximum. Maximum density is not always the answer. The better question a developer, or a buyer evaluating a parcel, should be asking is not "how many units can this land support," but "what does this market actually want to buy, and how fast will it buy it."
Financial and Commercial Metric | Scenario A: Condos | Scenario B: Homes |
|---|---|---|
Estimated Gross Sales: | $87,000,000 USD | $87,000,000 USD |
Total Inventory | 116 units | 58 units |
Average Selling Price | $750,000 USD | $1,50,000 USD |
Physical Absorption Rate | 1.58units/month | 1.45 units/month |
Proportional Absorption Rate | 1.36% monthly | 2.50% monthly |
Total Sellout Time | 6.1 years (73 months) | 3.3 years (40 months) |
Net Present Value | $32,491,212 USD | $42,408,178 USD |
The land cost is $12,000,000 USD, which represents just 13.79% of the Residual Land Value relative to Gross Sales.
*(Rate @16%)
The Bottom Line: Time is The Real Metric
When looking strictly at paper metrics or even total gross revenue, both scenarios for Montecito seem identical at $87M USD. But real estate development doesn't happen on a static spreadsheet; it happens in real-time, governed by the cost of capital.
When you factor in the time value of money NPV and the proportional absorption rate: The Single-Family Home path delivers nearly $10M USD more in Net Present Value ($42.4M vs $32.5M). It cuts the capital exposure and sellout timeline almost in half from 6.1 years down to 3.3 years. It requires less peak equity to build, allowing pre-sale velocity to autofinance construction far more effectively.
Moreover, because the land acquisition price sits at $12M USD representing a mere 13.79% land cost to gross sales ratio (well below the typical 18% - 25% development benchmark) the developer enters the deal with an extraordinary margin of safety from day one.
Price per square meter is a vanity metric. Maximum legal density is a paper fantasy. The true value of any development parcel is found at the intersection of smart zoning, market absorption velocity, and financial timing.
Before making an offer on raw land, stop asking what the dirt costs per meter or how many units you can cram onto the footprint. Ask the only question that actually drives profit: What does the market want right now, and how fast will it pay you back?